
Case study: CFD analysis helps develop up to 4X faster oil containment boom

By Chang-Fa An, DaimlerChrysler Technology Center, Auburn Hills, MI
Researchers using computational fluid dynamics (CFD) analysis have improved the velocity at which oil containment booms can operate successfully, increasing the current level of under 0.4 meters/second, where traditional booms fail, to a theoretically possible 2.0 meters/second.
The boom velocity is critical because oil spill cleanup is limited by how fast the booms can be towed before hydrodynamic forces cause them to fail. To develop a boom that operates at faster velocities, oil companies have been evaluating a number of new designs, including angled booms and porous nets that operate below and upstream of traditional booms.
Previously, researchers performed water channel tests to evaluate new designs but this added significantly to development costs. Now, CFD simulation is used instead. This alternative allows researchers to simulate many design alternatives quickly and inexpensively. Recently, researchers have also begun to animate CFD results to enhance their understanding of boom failure mechanisms.
When oil is accidentally spilled on water, the most common response is to use barriers or "booms" to collect the oil. A typical boom floats on the surface of the water and is composed of a cylindrical float with a skirt. In open water, it is towed behind a boat. In rivers and streams, it is placed in the current. In either situation, as oil collects behind the boom, it is recovered with skimming devices.
Booms reliably hold oil only under certain conditions, however. If they are towed too rapidly by ships or are deployed in fast moving streams or rivers, failure occurs due to hydrodynamic forces.
Traditional booms have been observed to fail when the water velocity is greater than about 0.4 meters/second. In recent years, oil companies and others have attempted to find new boom designs that can work in greater water velocity. This would permit faster cleanup operations in open water because it would allow the boats to travel faster. It would also make booms more effective in a greater number of rivers and streams.
Difficult testing
As with any new product, part of designing a new boom involves evaluating its performance under typical operating conditions. Oil boom testing is normally done in a tank, or channel, that is at least 30 meters long by 15 meters wide by two meters deep. It must be this large because this type of hydrodynamic study is affected by scale. The closer the scale is to real world conditions, the more accurate the results.
A boom is placed in the middle of the channel where there is an underwater observation window. The tank is instrumented with a flow velocity device. As water flows through the channel, oil is poured onto the water. From the observation window, researchers watch what happens to the oil when it reaches the boom. The speed of the water can be varied, as can the depth of the boom placement. What makes this type of testing expensive is the cost of the power needed to accelerate that volume of water through the channel. Also, once the experiment is over, the channel must be thoroughly cleaned to remove the oil.
Researchers have turned to CFD analysis as a less expensive way of predicting boom performance. A CFD simulation provides fluid velocity, pressure, and species concentration values throughout the solution domain for problems with complex geometries and boundary conditions. As part of the analysis, a researcher may change the geometry of the system or the boundary conditions such as inlet velocity, for example, and view the effect on fluid flow patterns or concentration distributions. CFD also can provide detailed parametric studies that can significantly reduce the amount of experimentation necessary to develop a device and thus reduce design cycle times and costs.
In simulating a water channel test with CFD, the goal is to get a thorough understanding of the effects of various parameters on the flow. For example, effects such as relative oil-water velocity, physical properties of oil and water, water depth, and boom draft can be investigated. Although most CFD programs can simulate a variety of fluid dynamics situations, an oil boom simulation adds a complicating factor that many programs cannot handle. The code must be able to distinguish two immiscible fluids, oil and water, and track the interface between them. The software FLUENT from Fluent Inc., Lebanon, NH, has a volume of fluid (VOF) model that is capable of modeling this situation accurately.
Preparing the analysis model
The first step in preparing a water channel simulation is the creation of a grid to conform to the problem geometry. Fluent's GeoMesh is used for this purpose. GeoMesh has three components: a CAD system called DDN, an interactive computational grid generation tool called P-Cube, and mesh visualization and manipulation software called Leo.
DDN is used to create the geometry representing the water channel and the boom. The lower half of the cylindrical float, the part submerged under the water surface, is represented by a semi-circle. The rigid skirt of the boom is represented by a vertical segment. P-Cube generates quadrilateral (2D) or hexahedral (3D) grids from this geometry. Leo is used to check grid quality and display the mesh.
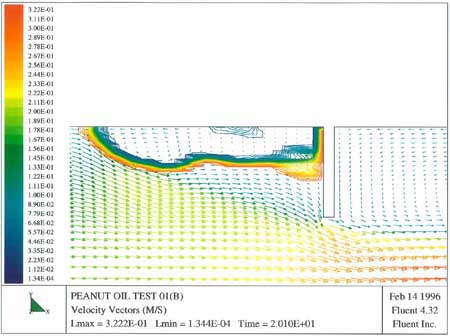
Next, the grid files generated by GeoMesh are imported into FLUENT where boundary conditions and other information about the problem are specified. For example, an inlet boundary is defined at the left of the model, and the region where the oil enters is specified. The flow surface is designated as a slip-wall on which a horizontal velocity component is allowed but a vertical velocity component is not. The channel floor and the surfaces of the boom are specified as no-slip walls. The right outlet boundary of the flow region is free of specification. The flow is turbulent and the standard k- model is used to close the Navier-Stokes equations. The VOF model is used to track the flow of the oil and water phases.
Evaluating boom designs
This model has been validated through comparisons to channel testing and researchers can now quickly evaluate the performance of new oil boom designs. To test a new design, engineers modify the boom geometry with GeoMesh, regenerate the grid, import the new grid into FLUENT, and run a new analysis.
One of the recently studied designs called a net-boom structure consists of a solid boom with front and bottom porous nets. The bottom net is horizontal. The front net can be vertical or positioned at an angle in relation to the boom. Because it is so easy to evaluate different design alternatives, researchers looked at numerous positions for the front net, including 0, 30, 49, and 67 degrees as measured from vertical. To adapt the analysis model to the new design with nets, engineers only needed to add porous regions (to represent the nets) as an additional momentum sink in the governing momentum equations.
After this series of analyses was completed, the researchers created a plot showing inclination angle against critical velocity. It was determined that the highest critical velocity was achieved when the front net was nearly vertical or inclined slightly forward. More importantly, this study proved that there is excellent potential to raise the critical velocity by putting a porous net structure in front of the boom.
For a single, solid boom (the traditional design), critical velocity 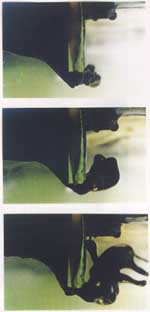 is found to be 0.3 to 0.4 meters/second. A solid boom with a partially perforated net will raise the critical velocity to 1.0 meters/second. The researchers believe that with further modifications to the net-boom structure design, they can raise the critical velocity to 2.0 meters/second and perhaps higher.
Animating the results
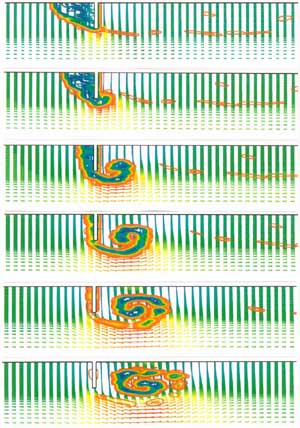
Until recently, researchers relied on static images of CFD results to understand oil boom failure and evaluate new designs. They have now started to combine these images into animated sequences that offer even greater insight into this time-dependent physical process.
The animation is created by playing a sequence of FLUENT images at a speed of 15 frames/second. The graphical output from the simulations was obtained in TIFF format and converted to device independent bitmap (DIB) format for use in VidEdit, from Microsoft Corp. This program is used to create the animations in audio video interleave (AVI) format. The animations can be viewed on a Pentium PC with the Media Player program supplied with Windows '95. The researchers involved in this work have found the animations to be particularly useful in understanding the failure mechanisms observed in channel experiments.
Using software to simulate the interaction between oil, water, and boom offers a less expensive alternative to channel testing, thereby reducing the cost of designing improved oil booms. Once they have a validated CFD model, researchers can quickly change the boom geometry and evaluate design alternatives. Using CFD, researchers have now identified a type of boom that has the potential to increase critical velocity by more than a factor of four. When implemented, the new net-boom structure will decrease the time needed for oil spill cleanup, protecting the environment from the effects of the oil.
In the United States, contact: Fluent Inc., 10 Cavendish Court, Centerra Resource Park, Lebanon, NH 03766. Phone: 603-643-2600, Fax: 603-643-3967. Visit Fluent's Web site at http://www.fluent.com.
Subscribe to our free e-mail newsletter.